Statistics: clients, team and plan
“Statistics” answers four questions: how much you've earned, whether clients come back, which masters they come back to, and whether the month's plan is on track. That's why it has four tabs: Overview, Clients, Team and Plan.
Statistics is available to the owner and administrators; an administrator sees only their own branches. Solo specialists don't have the “Team” tab.
Open Statistics
In the menu, go to Money and analytics → Statistics. The tabs are under the page title, and the filters are in a row above the tab.
Go to More → Statistics. The tabs switch under the header, and the icon in the top right corner opens the filters: in the Filters menu, tap a filter row and choose a value in the sheet.
“Overview”: revenue and bookings for the period
Revenue, bookings, how many clients came, average ticket, new clients, time utilization, revenue by day, top services and peak hours. Each figure is compared with the previous period of the same length; a month is compared with the previous month.
- Period — 7, 30 or 90 days, a year, Month with a month switcher, or custom dates.
- Employee — figures for one or several employees. An employee's revenue is their visits, the memberships they issued and the products they sold; their average ticket is their visits paid in money divided by the number of those visits.
- Days · Weeks · Months above the revenue chart sets the bar step. By default, it's chosen by the length of the period; the first and last weeks are cut at the period's boundaries.
- New clients — those who came to the company for the first time in the period. Clients marked “Visited before” don't count as new.
Period, employee, branch and booking type are rows of the Filters menu. With the Month period, a month switcher appears under the tabs; with custom dates, the Start and End fields.
“Clients”: do clients come back
This tab works by month: switch months with the arrows; figures are compared with the previous month. The month is shared by the “Clients”, “Team” and “Plan” tabs.
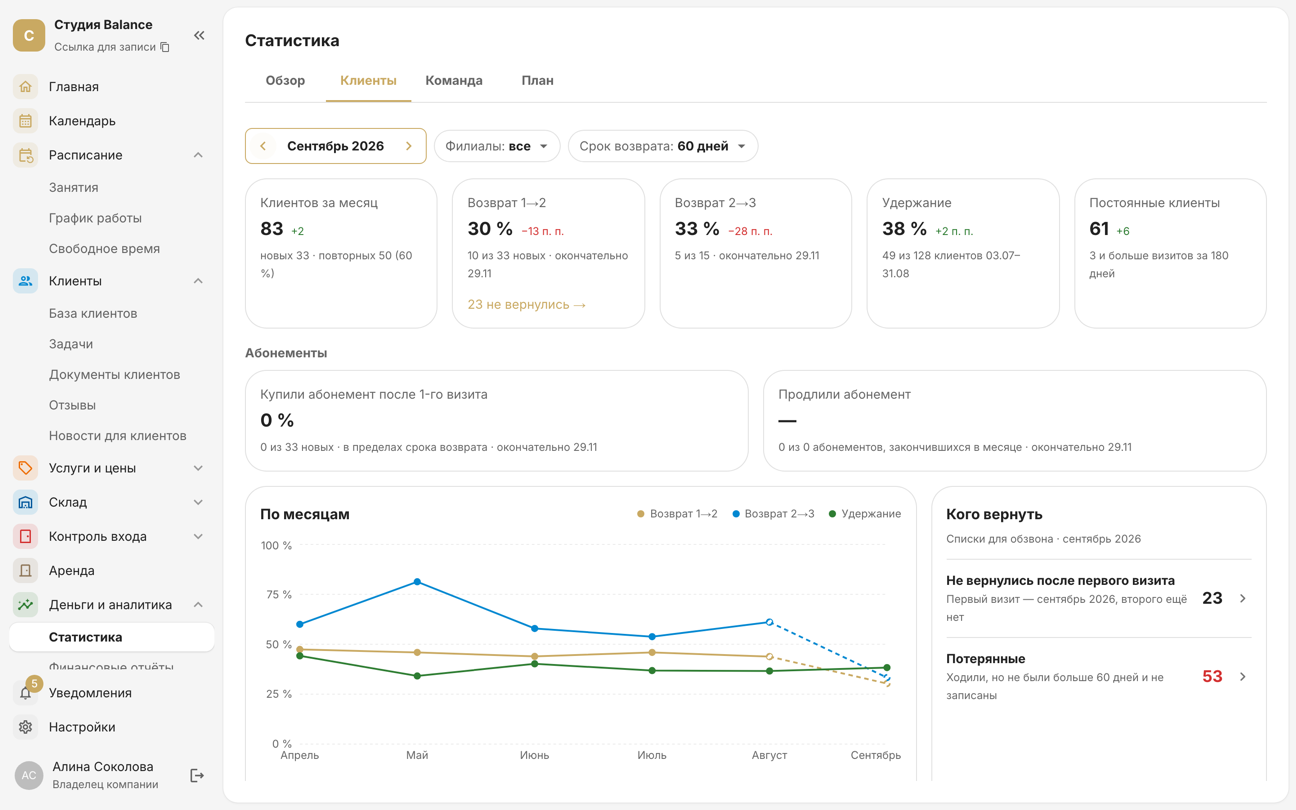
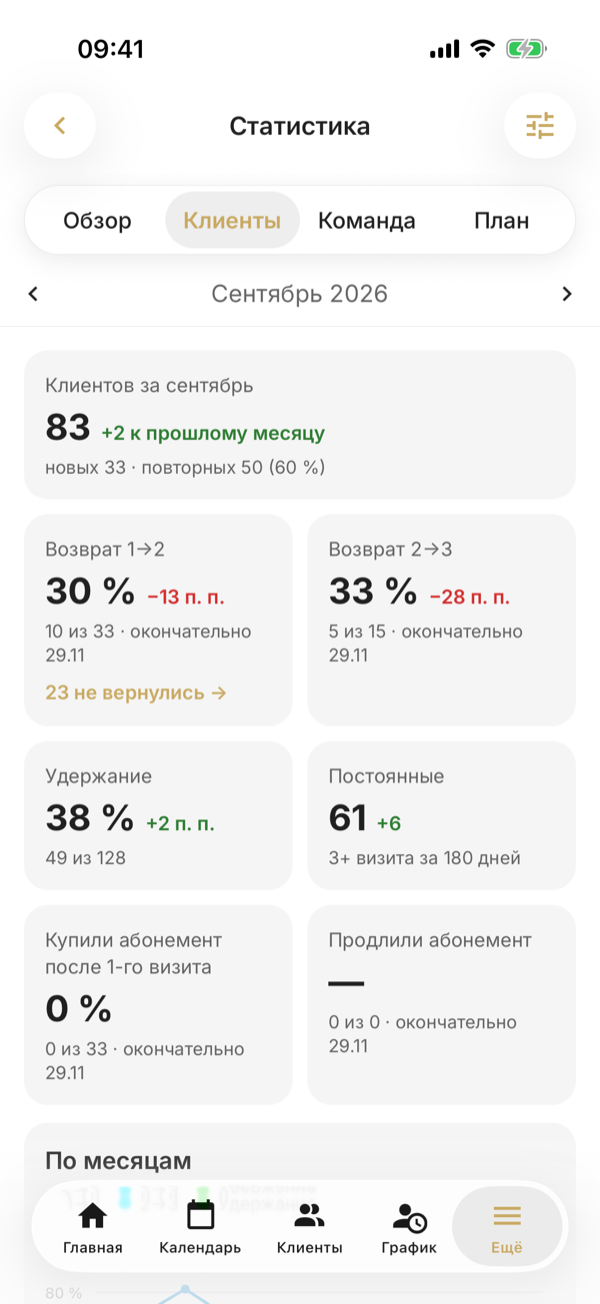
| Metric | How it's calculated |
|---|---|
| Clients this month | Everyone who came during the month: new and repeat clients — those who had been before. |
| Return 1→2 | New clients of the month who came a second time within the return window after their first visit. |
| Return 2→3 | Clients whose second visit was in the month and who came a third time within the return window. |
| Retention | Of the clients who visited during the return window before the start of the month, the share who came in the month. |
| Regular clients | Clients with three or more visits in the last 180 days; next to it — how many were added this month. |
| Bought a membership after the 1st visit | New clients who bought a membership on the day of their first visit or within the return window after it. |
| Renewed a membership | Of the memberships that ended in the month, the share whose holder has a next membership. |
The memberships row appears only if the company sells them. A visit is a booking with the “Attended” status, including one paid with a membership and a group session; “No-show”, cancellations and rentals don't count as visits. Clients marked “Visited before” aren't included in return 1→2 and 2→3.
- Return window — 30, 60, 90 or 120 days, 60 by default; your choice is remembered.
- N of M next to a percentage — how many clients it's based on: 50% of two clients isn't a trend yet.
- final on 12/30 — for some of the month's clients the return window is still open, so the figure may grow. On the “By month” chart, such months are drawn with a dashed line.
- Branches keeps the clients whose first visit was at that branch.
The new client retention table: a row is the month of the first visit, a cell is the share of those clients who came 1, 2 and 3 months later. It shows how well clients who first came in different months stay with you.
The Who to bring back block holds lists for calling. Didn't return after the first visit — the month's new clients without a second visit; for each one, you can see the date until which their return window stays open. Lost — clients who came twice or more, but haven't visited for longer than the return window and aren't booked for anything. Selecting a client opens their profile, and Export .xlsx saves the list as a file.
In the app, “Who to bring back” is at the bottom of the tab; a list opens in a sheet, and the export button is at the bottom of the sheet.
“Team”: who clients come back to
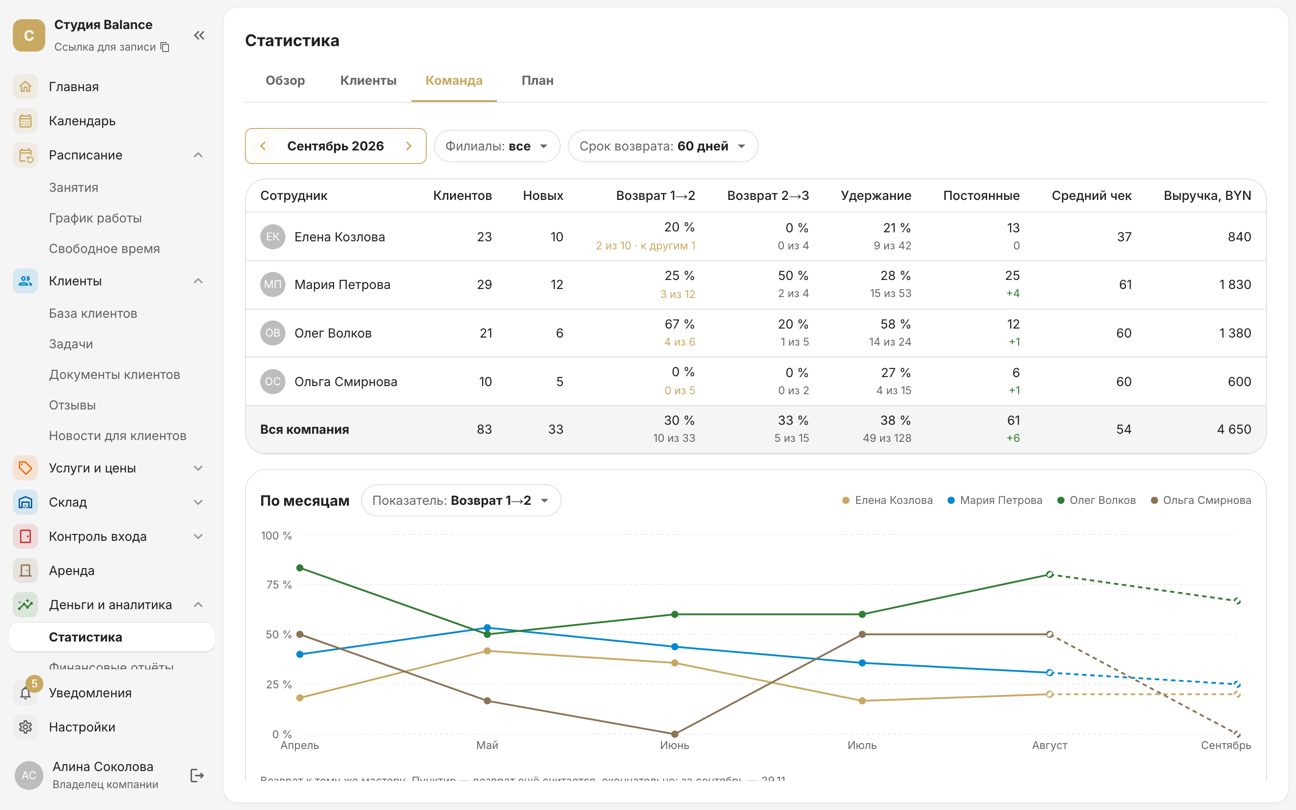
The same metrics for each master. A master's return 1→2 counts clients whose first visit to the company was with that master; returned clients are those who came a second time to the same master. How many of them went to other masters is shown as a separate grey figure. A master's average ticket is their visits paid in money divided by the number of those visits.
A table of masters with Whole company as the last row; under a master's Return 1→2, the “N of M” line opens the list of their clients who didn't return. Under the table is a chart of the selected metric by month, with a line for each master.
Choose the metric with the 1→2 · 2→3 · Retention · Regulars chips. Tapping a master opens their screen: all metrics for the month, the return chart and the “Didn't return” list for that master.
“Plan”: the monthly plan and forecast
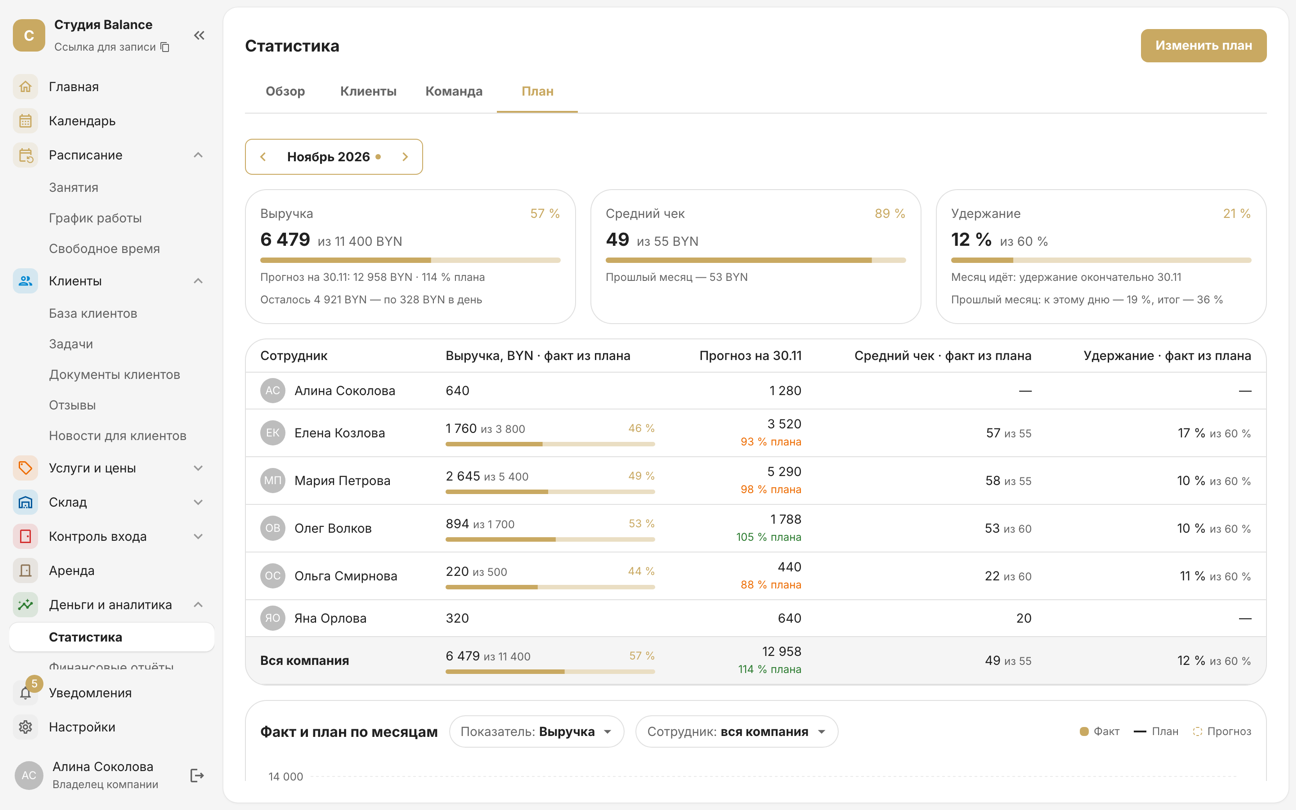
A plan is set for a month on three metrics — revenue, average ticket and retention — for the whole company and for each master. The tab shows the actual figure, the plan and the percentage of the plan achieved. For the current month's revenue, there's a forecast for the end of the month based on the average day and how much is left to earn per day; for retention, what it was by the same day of the previous month.
Click Set plan (if there's no plan yet) or Edit plan in the top right corner. The “Plan for …” panel lists “Whole company” and each master, each with three fields. Same as last month fills in the previous plan. An empty field means no plan for that metric. Then click Save.
Tap Set plan or Edit plan under the cards. At the top of the “Plan for …” screen there's a Revenue · Average ticket · Retention switcher, and below it a field for the whole company and for each master, with a caption showing last month's figure. Same as in … fills in the previous plan for all three metrics. Save with the checkmark in the top right corner.
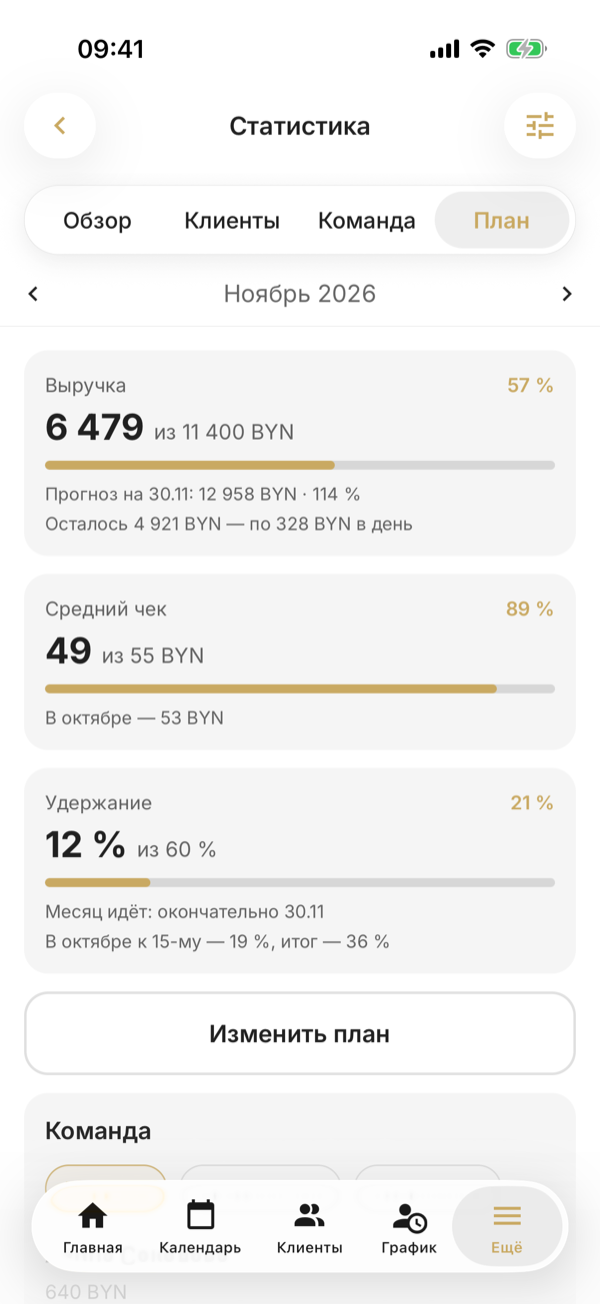
Only the owner can enter the plan. An administrator sees the plan and actual figures of the masters in their branches, without the whole-company row.
“My month” for masters
An employee with the Specialist role sees their plan and actual figures on the home page, in the My month card: revenue with a forecast, client retention, average ticket and last month's return 1→2. If there's no plan, only the actual figures are shown.
Pay a percentage based on client retention
In the pay scheme, “Percentage of revenue” has a By client retention option: the more of a master's clients come back to them, the higher the percentage. For example: up to 40% retention — 35% of revenue, from 40 to 55% — 40%, from 55% — 45%.
Open the employee and click Set up pay. In “Compensation components”, tick Percentage of revenue, choose By client retention in Percentage scheme, and choose the window in Master's clients over. Tiers 0–40 / 40–55 / 55+% creates three tiers — enter the percentages in them and click Save.
Go to More → Employees, choose the employee and tap Set up pay. On the “Employee pay” screen, tap Percentage of revenue, turn on Pay a percentage of revenue, choose By client retention in Percentage scheme, and choose the window in Master's clients over. Preset creates the tiers 0–40, 40–55 and from 55%: tap a tier, enter the percentage and confirm with the checkmark. Go back to “Employee pay” and save with the checkmark in the top right corner.
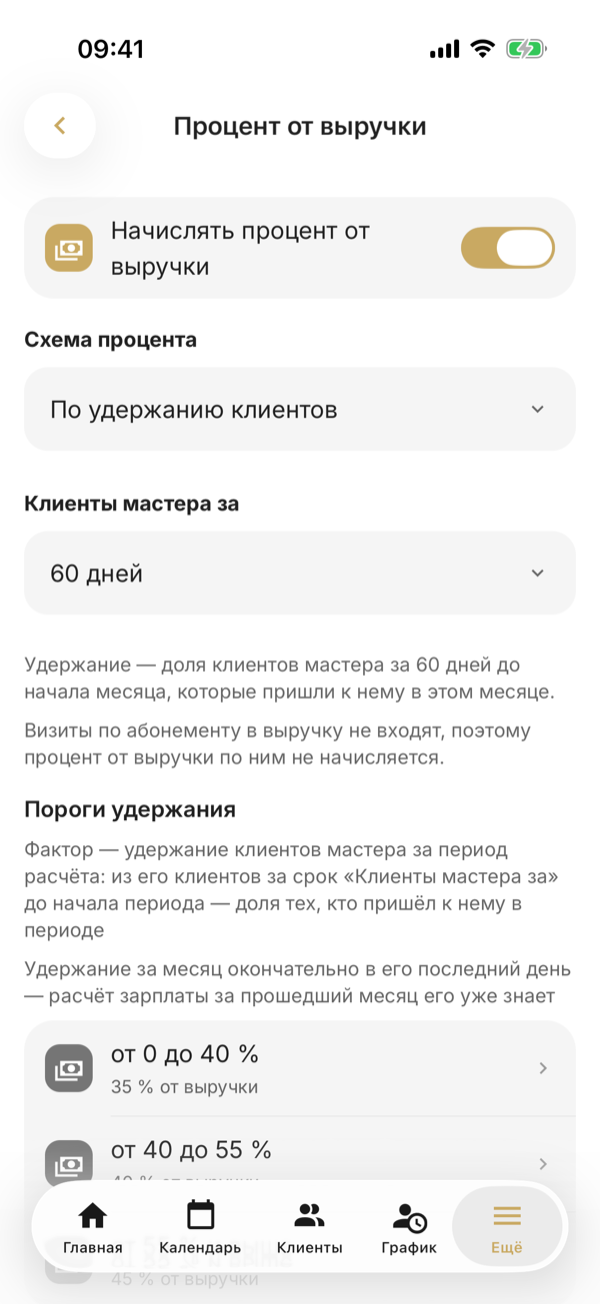
Retention for pay is the same as on the “Team” tab: of the clients who visited the master during the “Master's clients over” window before the start of the period, the share who came to that master in the period. For a past month, it's already final. The payroll calculation shows what retention came out, how many clients it's based on and which tier applied.
A new master may have no clients in the window — then retention is 0% and the first tier applies. Visits paid with a membership aren't included in revenue, so no percentage is accrued on them.